


U.S. Performance
U.S. hotels continued their steady seasonal lift with occupancy up to 64.7%, a 20-week high. The last time weekly occupancy was that high was back in late October 2022. Average daily rate (ADR) increased almost US$7 week over week to US$158. Aside from the week including New Year’s Eve, that was the best weekly ADR since October 2022, representing an 8.1% increase year over year, ahead of the 6% annual pace of inflation. Revenue per available room (RevPAR) increased to US$102 (+7.7% YoY) on that combined strength of occupancy and ADR.
Seven-day total demand for the U.S. exceeded 25.1 million rooms sold:
- +3.3% from last year
- + 0.7% from the matched week in 2019
- Second highest for the comparable week dating back to 2000.
The highest demand for the comparable week came in 2018 (week ending 10 March), with less than 100k more rooms than this week in 2023
The Top 25 Markets continued to see faster annual demand growth, up 7.6% YoY compared to +3.3% for non-Top 25 Markets. For the time being, the Top 25 Markets collectively maintain a narrow demand deficit (-0.7%) from 2019. In comparison, total demand within non-Top 25 Markets continues a consistent pattern of demand surpluses, with the recent week up 1.7% above its pre-COVID comparable.
Previous updates highlighted an industry “return towards normalcy,” a pattern that continued in the most recent week as the Top 25 Markets make up ground faster from their deeper performance deficits in 2020-22. Compared to the matched week last year, the Top 25 Markets in aggregate reported:
- considerable gains in occupancy (+4.3 ppts to 72.3%), ADR (+11.5% to $189) and RevPAR (+18.5% to $137)
- annual occupancy gains in 21 of 25 markets, led by Washington, D.C. (+12.1ppts to 67.6%), New York City (+10.9ppts to 78.3%) and Boston (+9.6ppts to 65.4%)
- Double-digit RevPAR growth in 21 of 25 markets, topped by Washington, D.C. (+50.2% to US$124), Boston (+39.0% to US$123), San Francisco (+38.8% to US$144) and NYC (+32.7% to US$181).
Non-Top 25 markets, in contrast, are showing more muted gains given their substantial recovery in the prior two years.
Group demand up in most Top 25 Markets, weekdays show solid gains
Group demand was up in most of the Top 25 with solid week-on-week growth in Anaheim (Orange County), Orlando and Nashville. Transient bookings increased by a healthy 6.4% WoW.
Monday-Wednesday occupancy showed solid gains from the previous week, ranging from +3.5 occupancy ppts (Monday) to +5.3ppts (Wednesday) within the Top 25. Occupancy in the 20 key central business districts (CBDs) reached 69.6% on weekdays (Monday-Wednesday) and ranged from 94.9% in Houston to 40.5% in Minneapolis. Eight of the 20 CBDs reported occupancy at or above 79%, including Atlanta, Dallas, New York’s Financial District, and Washington, D.C. Non-Top 25 Markets showed more seasonally modest weekday occupancy gains but experienced small declines from the combined Friday-Saturday period last year.
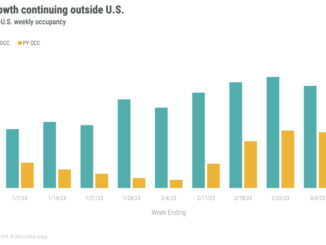
Global Performance
Global hotel occupancy (excluding the U.S.) continued to strengthen against last year’s Omicron comps. The most recent week’s occupancy (64%) improved modestly over the prior week as the spring holiday season begins. On an annual basis, the recent week’s results increased 14.2 ppt YoY.
The United Arab Emirates reclaimed its top global occupancy position at 89%, trading places with Barbados at 87.8%. Three other Caribbean countries were above 80% occupancy: Jamaica, Puerto Rico, and the Dominican Republic. In other corners of the world, Senegal and New Zealand rounded out the list of countries above 80% occupancy.
Among the 10 largest countries by hotel supply, occupancy reached 65% on average with a 13.1% YoY increase, which was higher than the rest of the world with an increase of 10.4% to 52%. The United Kingdom reported the highest weekly occupancy (74.5%) and has maintained the top spot for all of 2023. Germany, Indonesia, and China saw the greatest YoY gains.
Final thoughts
A return to normal continues with improvements across the U.S. Top 25 Markets and some softening among select non-urban markets that may have benefited from strong leisure patterns last year. Encouragingly, business transient growth appears to be gaining solid traction as weekday business-oriented travel increasingly flows into large key markets.
As a benchmarking matter, sharp improvements in annual U.S. performance have narrowed due to Omicron comparisons from 2022 falling off the calendar. Annual indexed indicators for demand and occupancy are expected to moderate from elevated levels earlier this year.
Looking ahead
U.S. industry indicators are expected to improve for the next couple of weeks as school breaks kick into high gear for the season.
For the week ending 18 March, we expect U.S. performance to see moderate gains (RevPAR up ~4% YoY, which is rather modest versus the double-digit gains seen since the pandemic subsided. Strong YoY comps are coming into play and will results in lower KPI gains for the remainder of the year.
In many other countries, the YoY comparables will remain strong a while longer given a later start to the recovery period last year.
This article originally appeared on STR.
Leave a Reply